Enhanced Performance Dashboard Widgets
A modern, responsive dashboard widget system with real-time performance indicators and percentage-based comparisons for Ultimate POS systems.
Overview
The Enhanced Performance Dashboard Widgets provide a comprehensive business intelligence interface featuring:
- Real-time percentage calculations vs previous periods
- Smart color-coded indicators for instant performance insights
- Interactive metric cards with hover animations
- Status indicators for secondary metrics
- Responsive Tailwind CSS design
Project Overview:
your-upos-project/
├── app/Http/Controllers/HomeController.php
├── resources/views/home/index.blade.php
└── public/js/home.js
Download Complete Files
📥 Download All Updated Files
Get all the modified files including controllers, views and JavaScript code to restyle dashboard widgets.
Widget Types
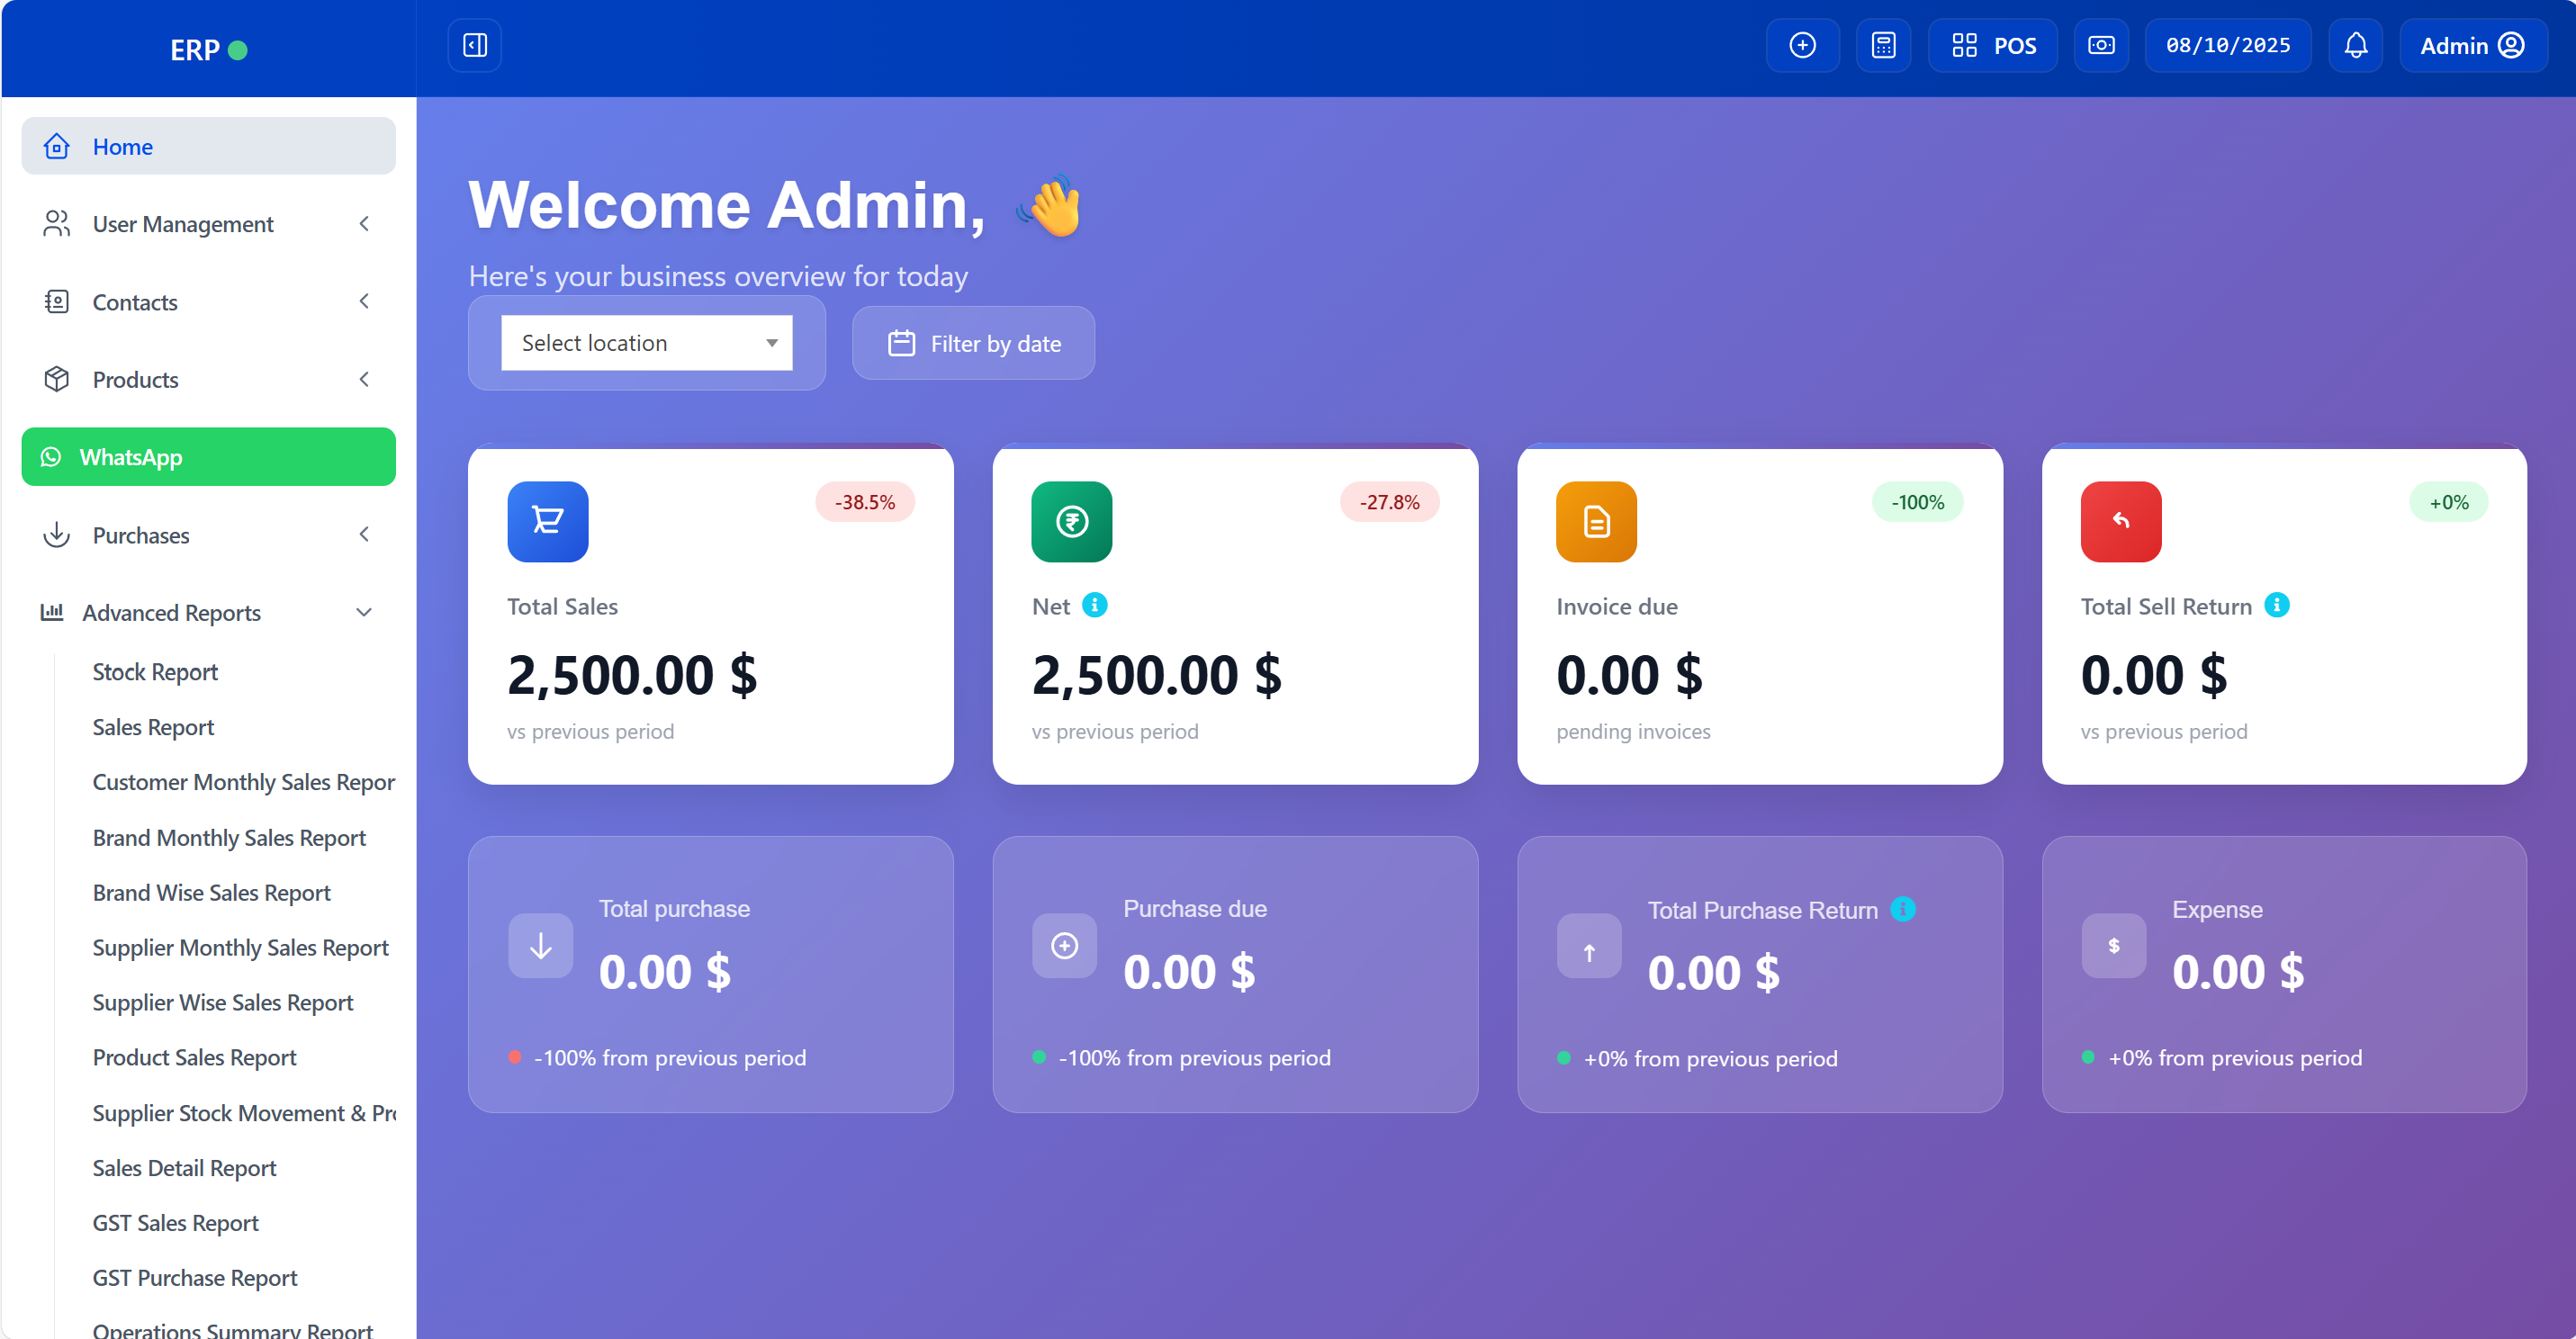
1. Primary Metric Cards
Four main performance indicators with percentage badges:
Sales Performance Card
- Metric: Total Sales
- Badge Logic: Green for increase ↗️, Red for decrease ↘️
- Comparison: Current period vs previous period
- Visual: Shopping cart icon with sky blue theme
Profit Analysis Card
- Metric: Net Profit
- Badge Logic: Green for profit increase ↗️, Red for decrease ↘️
- Calculation: Sales - Due Amounts - Expenses
- Visual: Dollar bill icon with green theme
Payment Tracking Card
- Metric: Invoice Due
- Badge Logic: Green for decrease ↘️ (better), Red for increase ↗️
- Purpose: Outstanding customer payments monitoring
- Visual: Document icon with yellow/warning theme
Returns Monitoring Card
- Metric: Sales Return
- Badge Logic: Green for decrease ↘️ (better), Red for increase ↗️
- Purpose: Product return trend analysis
- Visual: Return arrow icon with red theme
2. Secondary Status Cards
Four supporting metrics with status dot indicators:
Purchase Tracking Card
- Metric: Total Purchase
- Indicator: Colored dot + percentage text
- Logic: Green dot for increases, Red for decreases
- Position: Bottom-right status indicator
Supplier Payment Card
- Metric: Purchase Due
- Indicator: Smart color coding (Green for decreases)
- Purpose: Supplier payment obligations
- Logic: Lower dues = Better performance
Purchase Returns Card
- Metric: Purchase Return
- Indicator: Status dot with percentage change
- Purpose: Supplier return trend monitoring
Expense Control Card
- Metric: Total Expense
- Indicator: Blue dot for operational expenses
- Logic: Green for decreases (cost savings)
Key Features
🎨 Visual Design
- Modern Tailwind CSS styling
- Glassmorphism effects for secondary cards
- Smooth hover animations and transitions
- Responsive grid layout (1-4 columns based on screen size)
- Professional color schemes per metric type
📊 Smart Logic
- Percentage calculations compare current vs previous periods
- Reverse logic for metrics where lower is better (dues, returns)
- Color psychology: Green = Good, Red = Attention needed
- Real-time updates via AJAX calls
🔄 Interactive Elements
- Date range filtering with comparison period auto-adjustment
- Location-based filtering for multi-location businesses
- Hover effects with scale animations
- Loading states during data updates
📱 Responsive Behavior
- Desktop: 4-column grid layout
- Tablet: 2-column responsive grid
- Mobile: Single column stacked layout
- Touch-friendly interface elements
Technical Implementation
Backend Integration
// HomeController enhancement
public function getDashboardTotalsWithComparison($start, $end, $location_id)
{
    // Calculate current period data
    // Calculate previous period for comparison
    // Return percentage changes
    return [
        'total_sell' => $current_sell,
        'sell_change' => $percentage_change,
        // ... other metrics
    ];
}
Frontend JavaScript
// Real-time updates
function updateMetricBadge(selector, percentage, reverseLogic) {
    // Smart color application
    // Smooth animations
    // Badge text updates
}

function updateStatusIndicator(selector, percentage, suffix, reverseLogic) {
    // Status dot color changes
    // Percentage text updates
    // Visual feedback
}
CSS Styling
/* Dynamic badge colors */
.metric-badge.badge-positive { /* Green theme */ }
.metric-badge.badge-negative { /* Red theme */ }
.metric-badge.badge-warning { /* Yellow theme */ }

/* Status indicators */
.status-dot.dot-green { /* Success state */ }
.status-dot.dot-red { /* Alert state */ }
.status-dot.dot-yellow { /* Warning state */ }
Performance Benefits
📈 Business Intelligence
- Instant performance insights at a glance
- Trend identification through percentage comparisons
- Problem area highlighting with smart color coding
- Historical context for better decision making
👥 User Experience
- Intuitive visual language (colors convey meaning)
- Reduced cognitive load (percentage vs raw numbers)
- Mobile-optimized for on-the-go monitoring
- Professional appearance builds user confidence
⚡ Technical Advantages
- Lightweight implementation (minimal JS overhead)
- Scalable design (easy to add new metrics)
- Framework integration (works with existing Laravel/Blade)
- Real-time capable (AJAX-ready)
Configuration Options
Comparison Periods
- Same-length previous period (default)
- Month-over-month comparison
- Year-over-year analysis
- Custom baseline periods
Color Themes
- Primary metrics: Blue, Green, Yellow, Red
- Status indicators: Green, Yellow, Red, Blue
- Customizable color schemes per business branding
Animation Settings
- Hover effects: Scale, shadow, color transitions
- Loading states: Spinner animations
- Update transitions: Fade in/out effects
- Staggered animations: Cards appear sequentially
Integration Files
The complete implementation consists of three main files:
home/index.blade.php- Complete dashboard layout with enhanced metric cardsHomeController.php- Backend logic for percentage calculations and data processinghome.js- Frontend JavaScript for real-time updates and animations
Browser Support
- ✅ Modern browsers (Chrome, Firefox, Safari, Edge)
- ✅ Mobile browsers (iOS Safari, Chrome Mobile)
- ✅ Responsive design across all screen sizes
- ✅ Progressive enhancement (works without JS)
Future Enhancements
Potential Extensions
- Custom date range comparisons
- Goal tracking with progress indicators
- Drill-down capabilities for detailed analysis
- Export functionality for reports
- Notification system for threshold alerts
- Multi-currency support for international businesses
This widget system transforms static dashboard metrics into an intelligent, interactive business intelligence interface that provides immediate insights into business performance trends.
💛 Support this project